Integrate with Prometheus Latest
Overview of all Prometheus metrics that KEDA provides
Prometheus Exporter Metrics
Operator
The KEDA Operator exposes Prometheus metrics which can be scraped on port 8080 at /metrics. The following metrics are being gathered:
keda_build_info- Info metric, with static information about KEDA build like: version, git commit and Golang runtime info.keda_scaler_active- This metric marks whether the particular scaler is active (value == 1) or in-active (value == 0).keda_scaled_object_paused- This metric indicates whether a ScaledObject is paused (value == 1) or un-paused (value == 0).keda_scaler_metrics_value- The current value for each scaler’s metric that would be used by the HPA in computing the target average.keda_scaler_metrics_latency_seconds- The latency of retrieving current metric from each scaler.keda_scaler_detail_errors_total- The number of errors encountered for each scaler.keda_scaler_empty_upstream_responses_total- The number of times a scaler returned an empty response from its upstream source (e.g. a Prometheus query returning no results).keda_scaled_object_errors_total- The number of errors that have occurred for each ScaledObject.keda_scaled_job_errors_total- The number of errors that have occurred for each ScaledJob.keda_resource_registered_total- Total number of KEDA custom resources per namespace for each custom resource type (CRD) handled by the operator.keda_trigger_registered_total- Total number of triggers per trigger type handled by the operator.keda_internal_scale_loop_latency_seconds- Total deviation (in seconds) between the expected execution time and the actual execution time for the scaling loop. This latency could be produced due to accumulated scalers latencies or high load. This is an internal metric.keda_cloudeventsource_events_emitted_total- Measured emitted cloudevents with destination of this emitted event (eventsink) and emitted state.keda_cloudeventsource_events_queued- The number of events that are in the emitting queue.keda_scaler_http_requests_total- Total number of outbound HTTP requests issued during scaler metric collection.keda_scaler_http_request_duration_seconds- Histogram of the duration in seconds of outbound HTTP requests issued during scaler metric collection.keda_grpc_client_started_total- Total number of external scaler gRPC calls started by the client.keda_grpc_client_handled_total- Total number of external scaler gRPC calls completed by the client, regardless of success or failure.keda_grpc_client_msg_received_total- Total number of external scaler gRPC message receive attempts by the client.keda_grpc_client_msg_sent_total- Total number of external scaler gRPC message send attempts by the client.keda_grpc_client_handling_seconds- Histogram of external scaler gRPC call duration in seconds.keda_internal_metricsservice_grpc_server_started_total- Total number of RPCs started on the server.keda_internal_metricsservice_grpc_server_handled_total- Total number of RPCs completed on the server, regardless of success or failure.keda_internal_metricsservice_grpc_server_msg_received_total- Total number of RPC stream messages received on the server.keda_internal_metricsservice_grpc_server_msg_sent_total- Total number of gRPC stream messages sent by the server.keda_internal_metricsservice_grpc_server_handling_seconds- Histogram of response latency (seconds) of gRPC that had been application-level handled by the server.- Metrics exposed by the
Operator SDKframework as explained here.
Note: When you deploy the KEDA Operator without any scalers deployed, the only metric you will see is
keda_build_info. As you deploy scalers, you will start to see some of the metrics listed above but it is dependant on the types of scalers you have deployed.
By default, keda_scaler_http_request_duration_seconds is emitted with low-cardinality labels such as scaler and status_code. You can add the high-cardinality namespace, scaled_resource, trigger_name, and metric_name labels with --enable-high-cardinality-metrics-labels=true on the keda-operator deployment.
The external scaler gRPC client metrics include the scaler, grpc_service, grpc_method, and grpc_type labels. Completed calls also include grpc_code. When --enable-high-cardinality-metrics-labels=true is configured, they additionally include namespace, scaled_resource, trigger_name, and metric_name.
The message counters follow the upstream Prometheus gRPC middleware semantics: they include unary calls and count attempts, including errors and the final stream receive that returns EOF. For streaming calls, completion and duration are recorded when the stream ends; duration measures the full stream lifetime. The duration histogram uses the default Prometheus buckets (5 milliseconds through 10 seconds, plus the overflow bucket).
Admission Webhooks
The KEDA Webhooks expose Prometheus metrics which can be scraped on port 8080 at /metrics. The following metrics are being gathered:
keda_webhook_scaled_object_validation_total- The current value for scaled object validations.keda_webhook_scaled_object_validation_errors- The number of validation errors.
Metrics Server
The KEDA Metrics Adapter exposes Prometheus metrics which can be scraped on port 8080 at /metrics. The following metrics are being gathered:
keda_internal_metricsservice_grpc_client_started_total- Total number of RPCs started on the client.keda_internal_metricsservice_grpc_client_handled_total- Total number of RPCs completed by the client, regardless of success or failure.keda_internal_metricsservice_grpc_client_msg_received_total- Total number of RPC stream messages received by the client.keda_internal_metricsservice_grpc_client_msg_sent_total- Total number of gRPC stream messages sent by the client.keda_internal_metricsservice_grpc_client_handling_seconds- Histogram of response latency (seconds) of the gRPC until it is finished by the application.- Metrics exposed by the
Operator SDKframework as explained here. - Metrics exposed (prepended with
apiserver_) by Kubernetes API Server
The keda_internal_metricsservice_grpc_client_* metrics are emitted by the KEDA Metrics Adapter and are not controlled by --enable-high-cardinality-metrics-labels.
Premade Grafana dashboard
A premade Grafana dashboard is available to visualize metrics exposed by the KEDA Metrics Adapter.
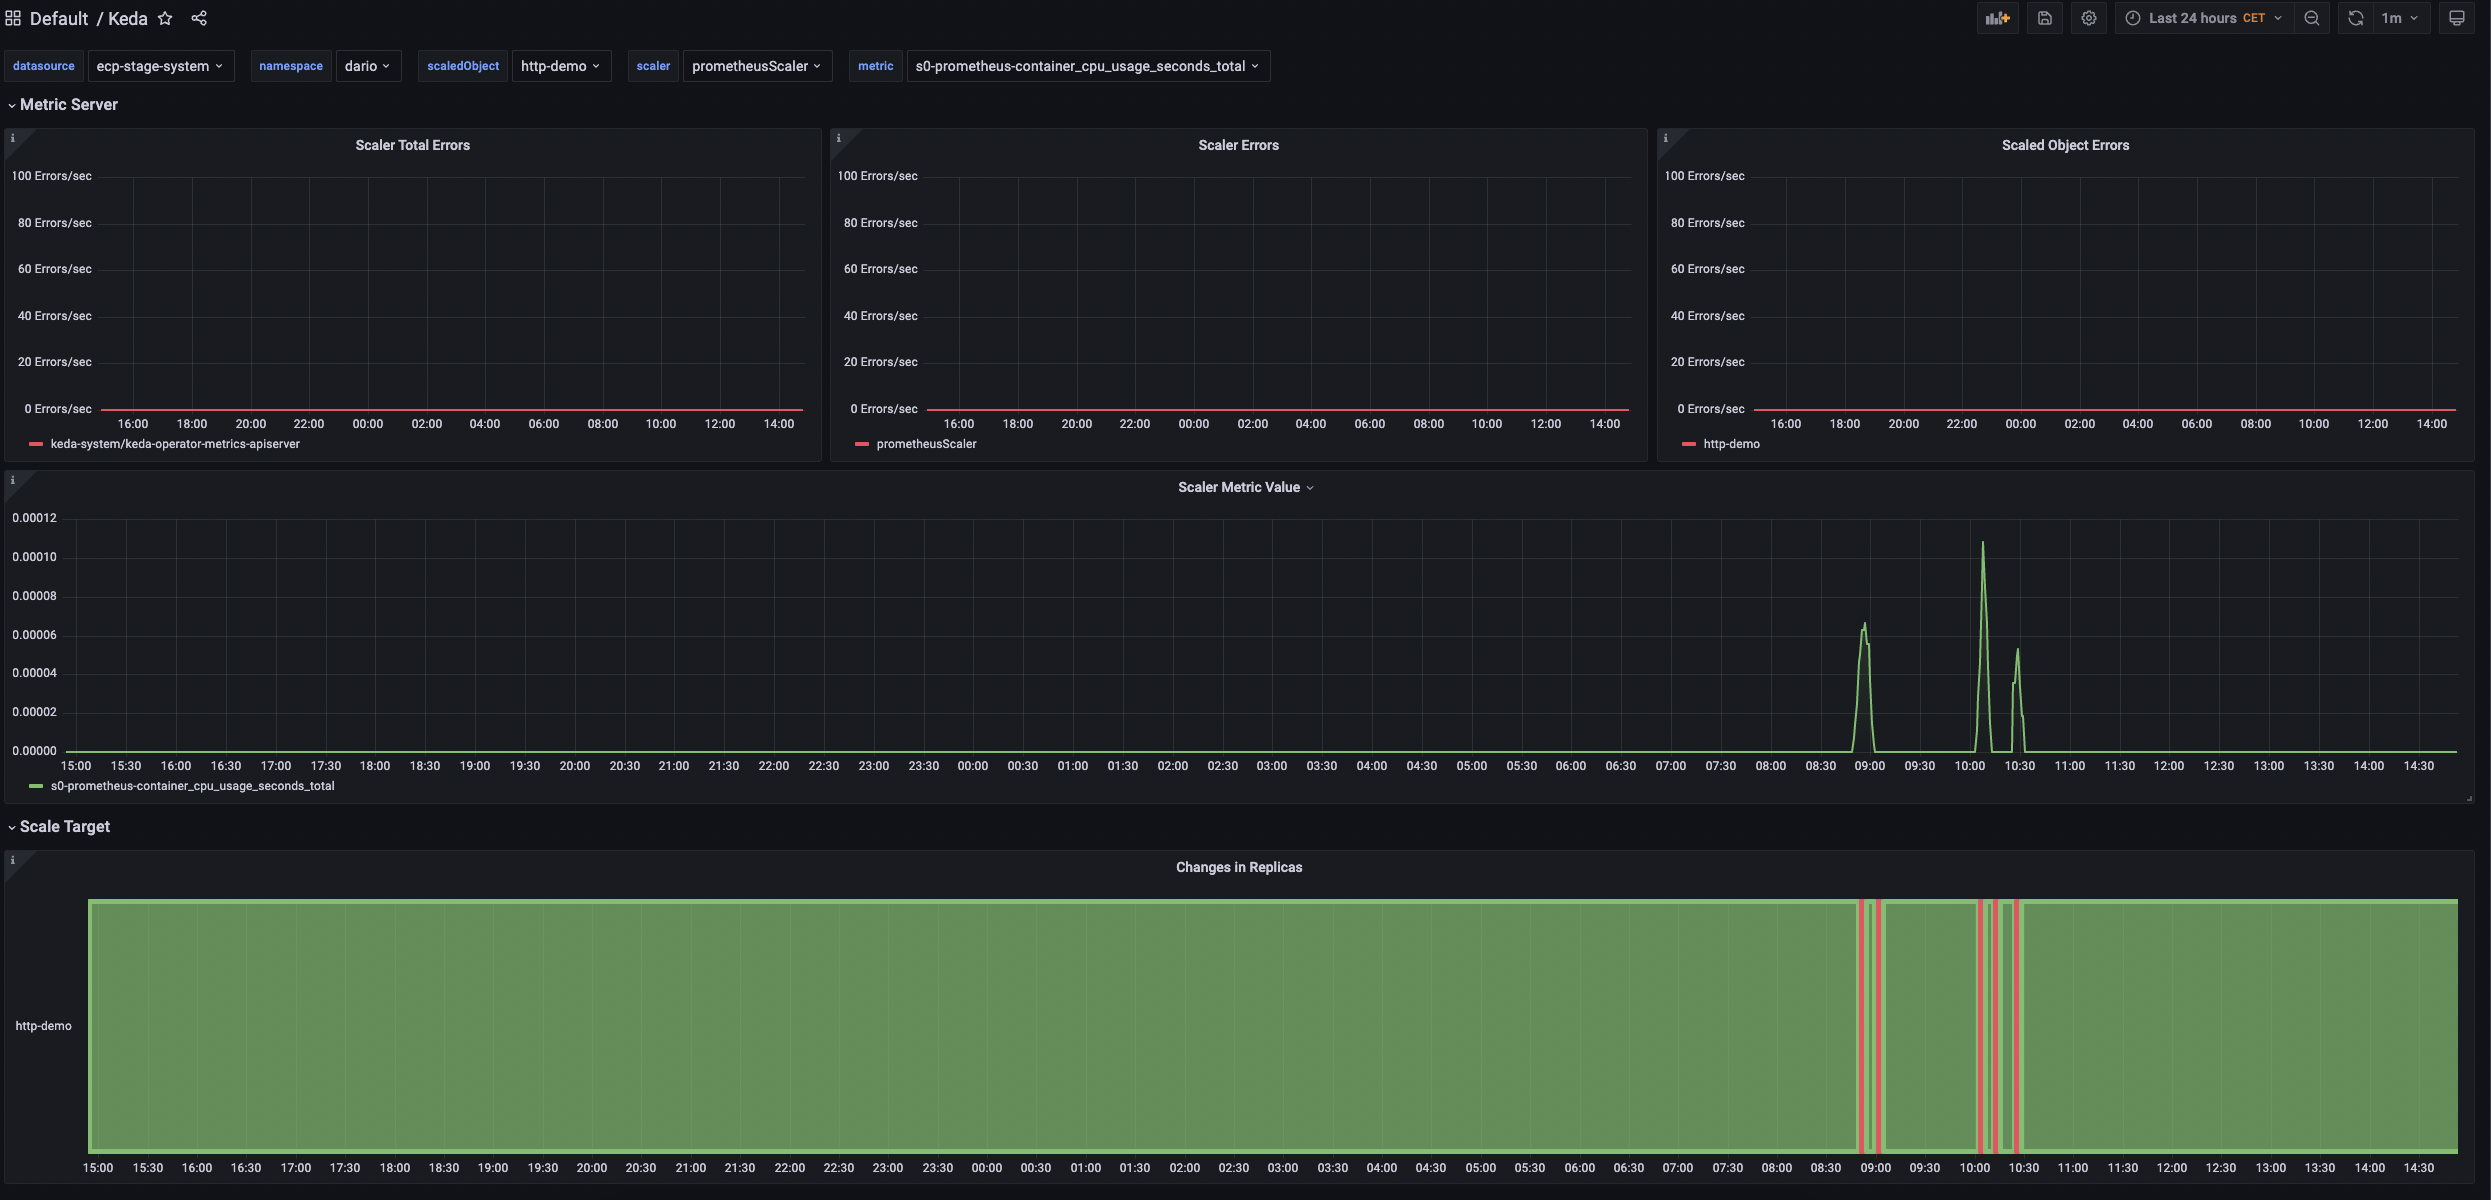
The dashboard has two sections:
- Visualization of KEDA’s metric server
- Visualization of the scale target and its changes in replicas scaled by KEDA
On top, the dashboard supports the following variables:
- datasource
- namespace
- scaledObject
- scaledJob
- scaler
- metric